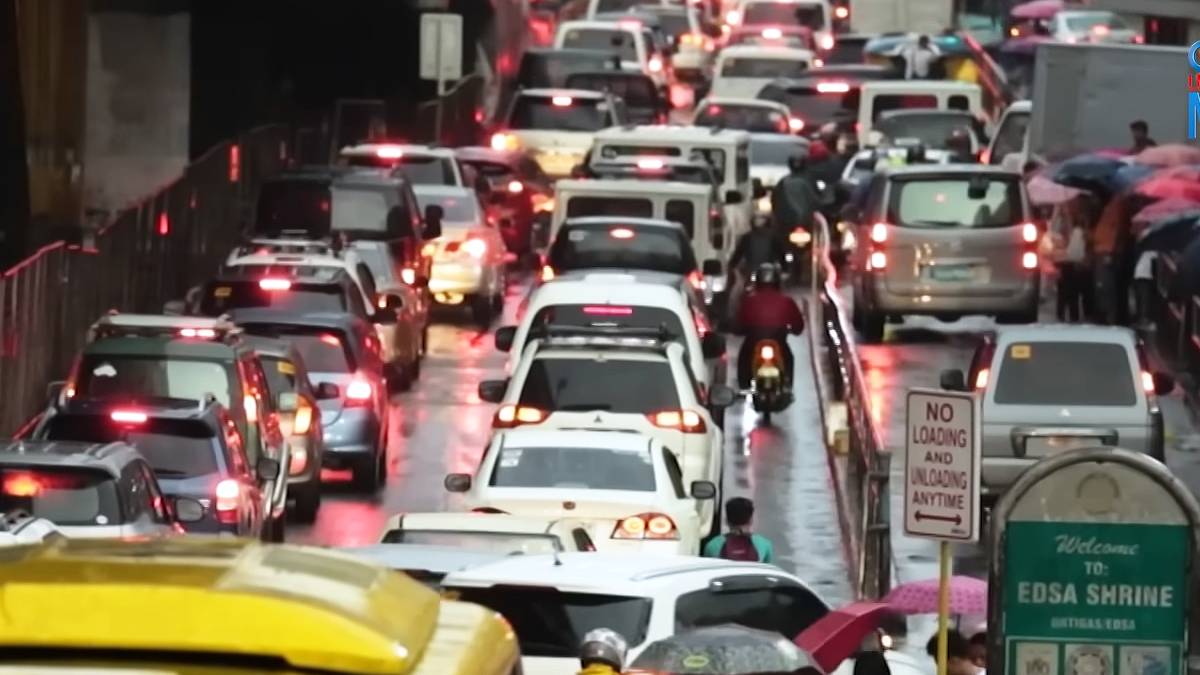

Top 1 ang Metro Manila sa listahan ng may worst traffic congestion sa 387 metro areas mula sa 55 countries worldwide para sa taong 2023.
Ayon sa TomTom Traffic Index, ang mga motorista sa Pilipinas ay nagtatagal sa kalsada ng average na 25 minutes at 30 seconds per 10 kilometers noong 2023.
Mas mataas ito ng 50 seconds noong 2022. Nangangahulugan ito na noong 2023, nagtatagal ang motorista ng 240 hours sa kalsada.
Ang 117 hours naman dito ay ginugugol sa pagkaipit sa trapiko. In short, katumbas nito ay limang araw sa traffic.
Nagbigay pa ng halimbawa ang TomTom na 48 books na ang maaaring mabasa sa halos limang araw na iyon.
Para sa mga Pilipino, katumbas nito ay limang araw na maaaring makatapos ng mahabang TV series o limang araw na bakasyon.
Read: PCSO head on controversial photo of lotto winner: “We’re not very good at editing…”
Pinakamatindi raw ang traffic pagsapit ng Biyernes, mula 5:00 pm hanggang 6:00 pm, kung kelan tumatagal ang biyahe ng hanggang 35 minutes and 30 seconds kada 10 kilometers.
Mula sa real-time traffic services ng TomTom Traffic Index, naa-analyze ang “congestion and incidents to predict traffic before it happens.”
Read: Online gamer from Pampanga buys Daniel Padilla’s Chevrolet Corvette Stingray for PHP6 million
Narito naman ang Top 10 most congested metro areas batay sa TomTom Traffic Index noong 2023. Ang bawat oras dito ay may travel distance na 10 kilometers
1. Metro Manila, Philippines – 25 mins and 30 secs
2. Lima, Peru, - 24 mins and 30 secs
3. Bengalaru, India – 23 mins and 50 secs
4. Sapporo, Japan – 23 mins and 30 secs
5. Bogota, Colombia – 23 mins and 30 secs
6. Taichung, Taiwan – 22 mins and 30 secs
7. Mumbai, India – 22 mins and 30 secs
8. Kaohsiung, Taiwan – 22 mins and 20 secs
9. Pune, India – 22 mins and 10 secs
10. Nagoya, Japan – 22 mins and 10 secs